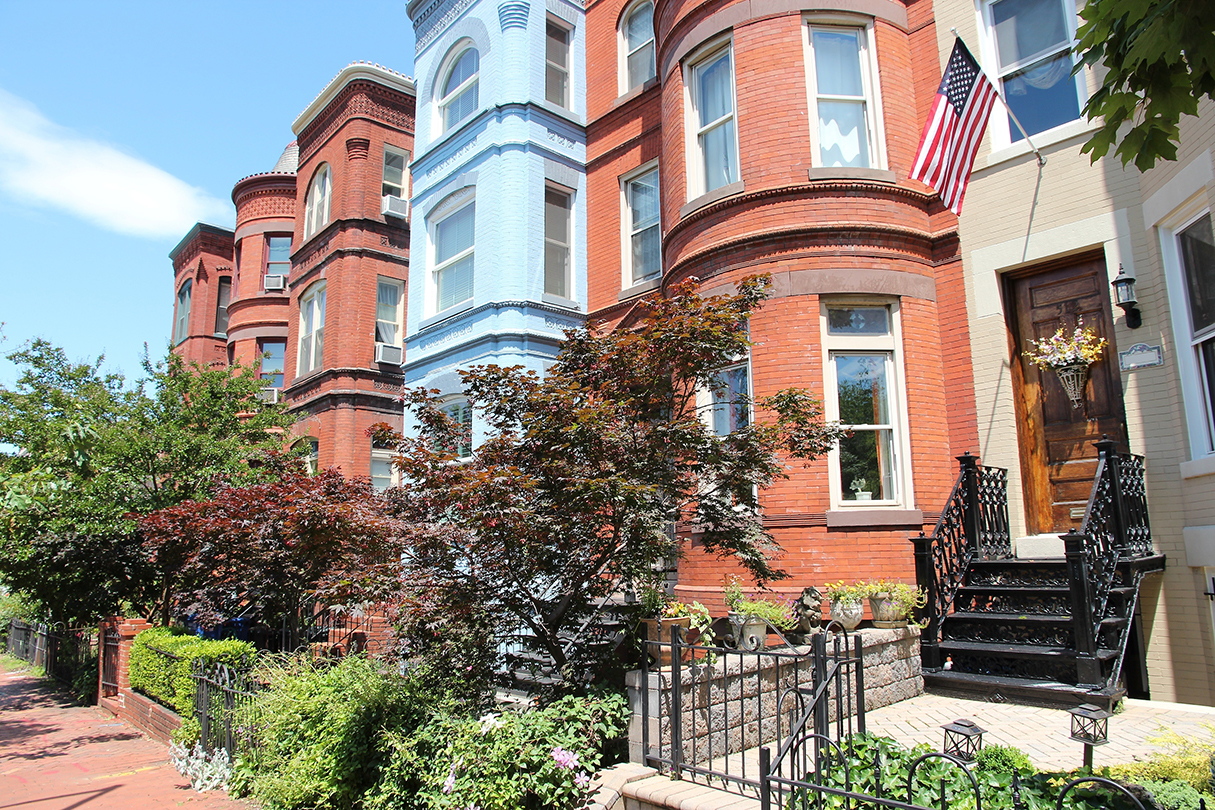
University of Illinois economist David Albouy tabulates cost of living, wages, and commuting expenses to come up with something he calls the Sacrifice Index. It measures the desirability of a place, and it’s quantified as the percentage of income people are willing to give up to live there. The higher the number, the more sought-after the locale. Compared with ten years ago, people all over Washington are fine with sacrificing more.
| Local | 2000 | 2010 |
|---|---|---|
| Northwest DC/Georgetown | 20% | 26.7% |
| Arlington County | 11.6% | 16.3% |
| Alexandria | 10.4% | 15.9% |
| Montgomery County | 7.5% | 12.7% |
| Downtown DC/Dupont Circle | 1.4% | 12.5% |
| Fairfax County | 6.8% | 10.6% |
| Loudoun County | 1.8% | 6.4% |
| Capitol Hill/Northeast DC | -1.1% | 6.2% |
| Prince George’s County | 0.6% | 3.1% |
| Anacostia/East of River | -6.9% | -6.2% |
…but Not as Much as in Some Other Places
Over the entire Washington metropolitan statistical area–which includes parts of West Virginia–people were willing to give up 7.7 percent of their income. In places like Honolulu or San Francisco, they were willing to give up more. Here are the nine places that outrank the Washington region, and what percentage of their income people in those spots are willing to give up:
| National | 2000 | 2010 |
|---|---|---|
| Honolulu | 19.0% | 24.2% |
| San Francisco | 20.7% | 17.7% |
| Orange County, California | 11.8% | 16.2% |
| New York City | 7.0% | 13.9% |
| Los Angeles/Long Beach | 8.7% | 13.1% |
| Miami | 7.1% | 12.4% |
| Portland, Maine | 5.4% | 9.9% |
| San Jose | 15.8% | 9.5% |
| Boston | 5.7% | 9.0% |
| Washington, DC | 3.8% | 7.7% |
This article appears in the November 2014 issue of Washingtonian.


