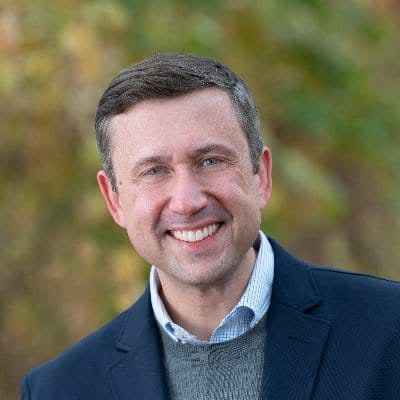
Alan Merten took the helm of George Mason University in 1996 with big plans—none of them aimed at attracting minority students to the largely white commuter campus in Fairfax. “That didn’t even make my top ten,” Merten says.
Ten years later, the Princeton Review college guide quoted George Mason students as calling their school America’s most diverse university. Students hail from 140 countries, and minorities make up a third of its enrollment.
This makeover is due not to affirmative-action admissions but to changes in Northern Virginia, from which George Mason draws more than 70 percent of its students. Immigrants have flocked to the region during Merten’s decade as president and turned to the university to help them grab the American dream.
George Mason is not the only area institution getting remade by immigration. Thousands of Ethiopians, Koreans, Salvadorans, and other recent arrivals enroll at Montgomery College, which has given it new cachet as a destination for foreign students looking to study in the United States. Roughly a third of MC’s 22,000 students are born outside the States.
The immigration boom echoes most strongly in public schools. Fairfax enrolls nearly 30,000 foreign-born K–12 students—about twice the number found in the entire metro area 20 years ago. In the tiny Manassas City school system, whose 6,337 kids would barely fill the stands at a big high-school football game, students speak 30 languages. Nearly a third are in the district’s English for Speakers of Other Languages program—the second-highest rate in Virginia.
Such numbers conjure up melting-pot imagery that can be misleading. Enrollments at many area public schools reflect the racial and ethnic segregation of the neighborhoods from which they draw. Analyzing 2000–01 data, Harvard University’s Civil Rights Project concluded that the typical white student in Fairfax went to school with large numbers of whites and got little exposure to blacks or Hispanics. The typical white student in Montgomery, the study found, had little contact with Hispanics.
Even schools where the diversity of faces looks like a Benetton commercial find that multicultural mingling is limited. “The socioeconomic gap between the middle-class white kids and some of the other students is huge,” says Mercedes Bustillo, cochair of a Hispanic parents group at Fairfax’s J.E.B. Stuart High School. “They don’t have that much in common. I just wish the groups mixed more and learned more from each other.”
Still, the diversity has transformed suburbia’s classrooms. One by one, suburban jurisdictions have seen their percentage of white students slip below 50 percent. Fairfax hangs on the edge with 50.2 percent; when it tips—likely this year—whites will no longer be a majority in any of the five school systems nearest to DC.
Some of the new arrivals to public schools are rising to the top of the classÂ. Of the four area finalists in the prestigious Intel science contest, two were born in China and a third in the Philippines. At Thomas Jefferson, the Fairfax science-and-math magnet school, Asians and Asian-Americans make up a third of students.
Immigration also has introduced to affluent schools thousands of students who live in poverty and don’t speak English. Administrators have scrambled to build a scaffolding to help these kids succeed—expanded programs to teach English, remedial classes in middle and high schools, and support networks for parents and kids.
In some cases, it’s paying off. Silver Spring’s Viers Mill Elementary, a predominantly Hispanic school with a 68-percent poverty rate, was named a national Blue Ribbon School. Third-graders’ reading-proficiency rates on state tests reached almost 90 percent last spring—this only three years after nearly half the grade scored at basic levels.
“The message to parents is, your kid is going to college,” says principal Matthew Devan.
Stuart High, where nearly half the students are foreign-born, emerged as a model for schools nationwide during the tenure of principal Mel Riddile. He arrived in 1997 and with the faculty defined a mission: Improve students’ basic skills but also set high expectations for every child. The rigorous International Baccalaureate diploma program that Riddile introduced remains largely filled with white middle- and upper-middle-class students, but the school is pushing all students with potential to take on the challenge of a few IB courses.
Riddile, who won national Principal of the Year honors last school year, moved this fall to Alexandria’s T.C. Williams High, where he once again will meet families from a dizzying array of countries. In the end, he says, all parents want the same thing as teachers do: “To put something on the refrigerator that says their kids did well.” —Drew Lindsay
| School System | % White 1995 | % White 2005 | % Black 1995 | % Black 2005 | % Hispanic 1995 | % Hispanic 2005 | % Asian 1995 | % Asian 2005 |
| Alexandria | 27 | 24 | 49 | 44 | 18 | 27 | 6 | 6 |
| Arlington | 43 | 46 | 18 | 14 | 30 | 29 | 10 | 10 |
| Fairfax County | 67 | 50 | 11 | 11 | 9 | 16 | 13 | 17 |
| Falls Church | 81 | 76 | 4 | 5 | 9 | 8 | 6 | 11 |
| Loudoun | 84 | 67 | 9 | 8 | 3 | 12 | 4 | 11 |
| Prince William | 70 | 45 | 19 | 22 | 6 | 22 | 4 | 7 |
| Anne Arundel | 79 | 70 | 17 | 22 | 1 | 5 | 2 | 3 |
| Howard | 76 | 61 | 15 | 20 | 2 | 4 | 7 | 13 |
| Montgomery | 57 | 42 | 19 | 23 | 12 | 20 | 12 | 15 |
| Prince George’s | 20 | 6 | 70 | 76 | 5 | 14 | 4 | 3 |
| District | 4 | 5 | 86 | 84 | 2 | 9 | 8 | 2 |
Sources: Washington Post, school systems • Figures may not total 100 percent due to rounding and because multiracial or nonspecified minority groups are not counted. Falls Church numbers cited as 1995 reflect 1996.
The Color of Classrooms
The percentage of whites in each suburban school system is smaller—sometimes much smaller—than the percentage of whites living in the jurisdiction, thanks to high birth rates among immigrants, the aging of whites, and white students enrolled in private schools.
| Location | % population white | % enrollment white |
| Falls Church | 85 | 76 |
| Arlington | 74 | 46 |
| Loudoun | 74 | 67 |
| Howard | 69 | 61 |
| Alexandria | 68 | 24 |
| Fairfax County | 68 | 49 |
| Prince William | 63 | 45 |
| Montgomery | 61 | 42 |
| Prince George’s | 22 | 6 |
Sources: US Census Bureau, area school systems

