How happy is your doctor? He tells you to exercise, but does he even make it to the gym during the week? She says to cut back on the food, but is she packing on the pounds under that white coat?
Now we have the answer to all those questions, and more. In a fascinating survey conducted by Medscape, 30,000 US physicians were asked about their lives outside of the hospital or office, from how they spend their free time to how many drinks a day they have. The results give a glimpse into how different–or surprisingly similar–doctors are to the rest of us.
The Happiest Doctors Are . . .
According to the report, the happiest physicians, both male and female, are rheumatologists. One-third of these happy doctors, who gave themselves a 5 on a happiness scale of 1 to 5, are US-born, exercise four times a week, have one to two drinks per day, and don’t smoke. They’re also married, actively practice a religion, maintain good financial health, and are over the age of 60.
The Unhappiest Doctors Are . . .
On the other hand, general physicians (think internists, family physicians, and general surgeons) are the unhappiest, followed by gastroenterologists and neurologists. Collectively they scored an average of 3.88 on the rating scale. Typically these doctors are in their mid-fifties and immigrated to the US as adults. They barely exercise, meaning they are overweight or obese, and have little to no savings. In addition, they do not practice a religion and are separated from their partners. Surprisingly, though, while male surgeons have a higher rate of alcohol abuse than the rest of the US, these unhappy folks did not report imbibing.
A big contributing factor to general physicians’ displeasure might be their lack of vacation, the report cited. Participants reported taking off no more than two weeks per year, while anesthesiologists and radiologists reported taking more than four weeks of vacation a year. The only anomaly was plastic surgeons, who reported the least vacation time of all physicians. They also reported the most debt.
How Political are Doctors?
When it comes to the political spectrum, Medscape reported that physicians “seem to be slightly more extreme on either side.” Approximately 62.5 percent of doctors described themselves as socially and fiscally conservative, while female physicians were more likely to describe themselves as liberal in both areas.
The Most Conservative? Plastic surgeons, at 82.2 percent. Anesthesiologists weren’t far behind. However, physicians in the following fields identified themselves as more liberal: infectious diseases, psychiatry, neurology, and oncology.
How Active and Healthy Are Doctors?
Turns out that the older a doctor is, the more likely he or she exercises at least twice a week. However, the report found that 7 percent of females and 8 percent of males don’t exercise at all.
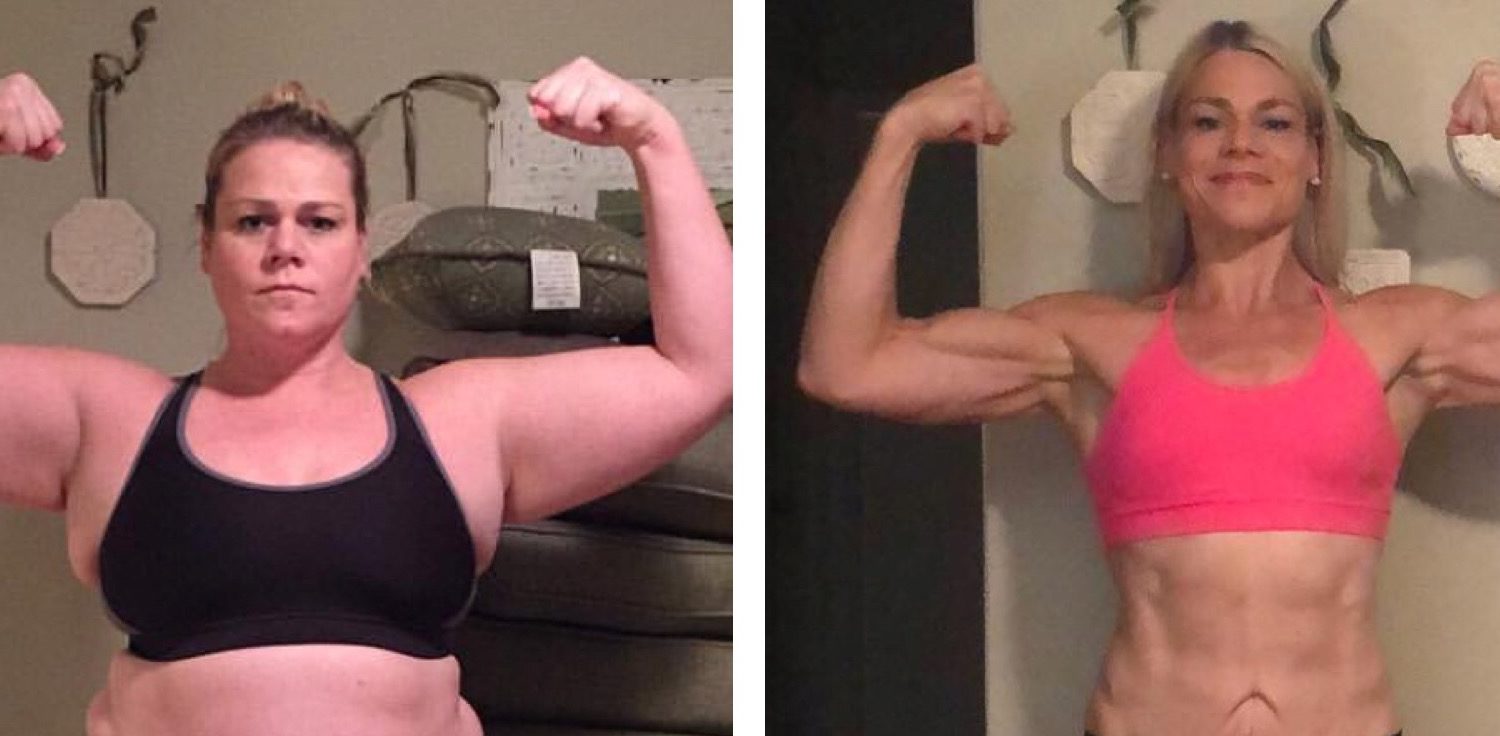
This may explain the fact that approximately 43 percent of males and 38 percent of female doctors in the study were categorized as obese.
The healthiest doctors, according to the report, are dermatologists, followed by plastic surgeons, endocrinologists, orthopedists, and cardiologists, respectively.
To see the full results, click here.

