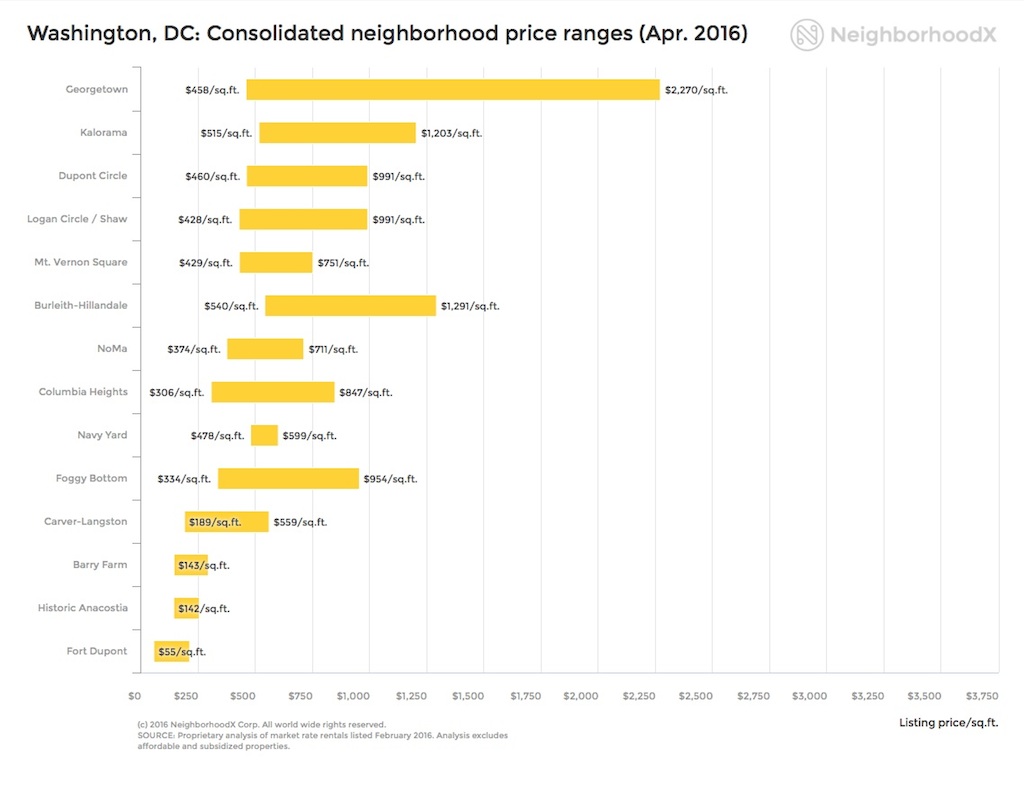
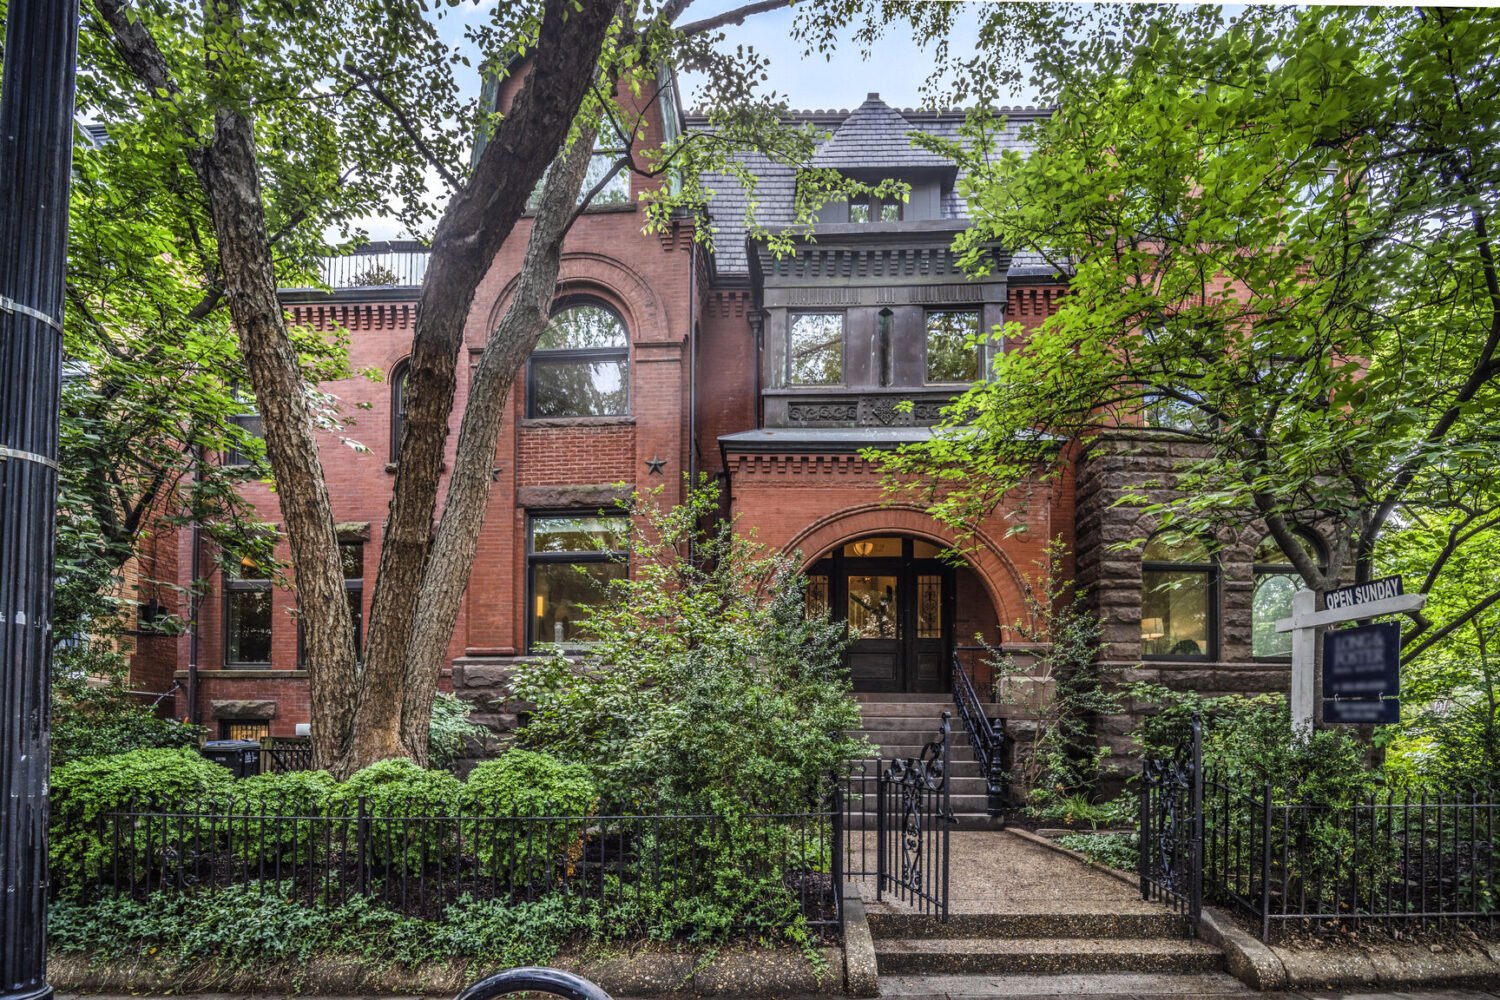
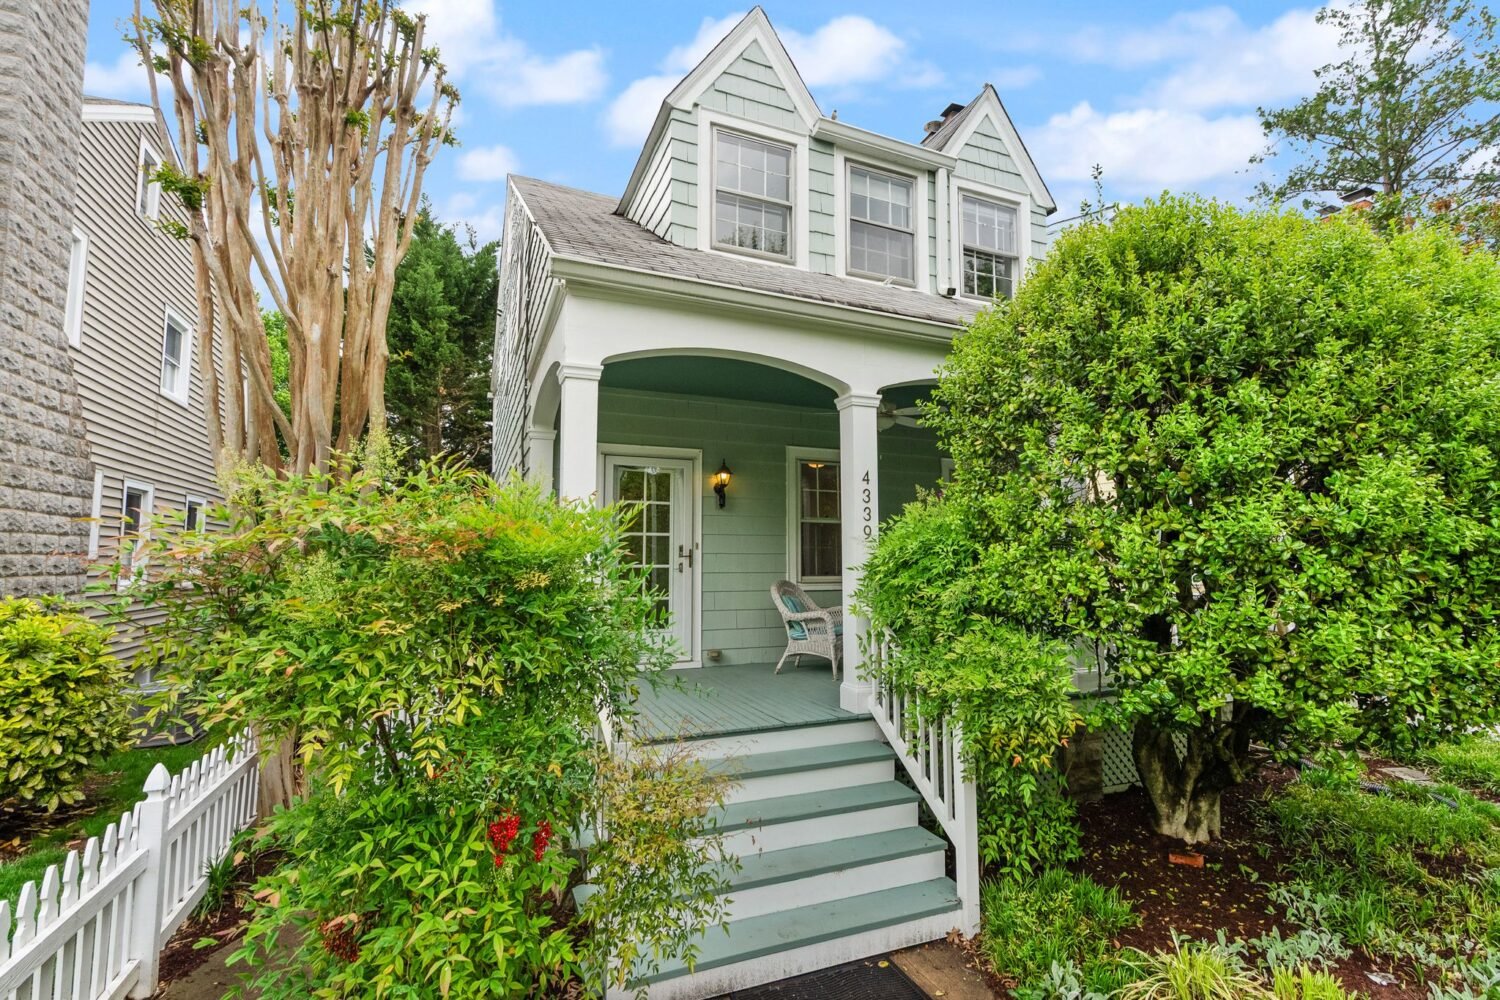
It’s officially peak house-hunting season in DC—the time of year when frustrated wannabe buyers consume the most adult beverages, and most frequently threaten to move to Columbus if they lose one more bidding war. Okay, so those aren’t actual stats. But the ones in the chart below, from real-estate analytics and research firm NeighborhoodX, are in fact a real representation of DC’s housing market in the month of April.
NeighborhoodX cofounder Constantine Valhouli says his team analyzed all residential, market-rate listings in 14 DC neighborhoods (chosen, he says, to give a “representative” sampling of the city) to determine the price-per-square-foot ranges in the chart. Click here for an interactive version that allows you to see more data by hovering over the prices.
While it’s no shock that Georgetown had the priciest listing ($2,270 per square foot for what Valhouli says was a massive luxury condo by the waterfront), it is notable that the nabe’s least expensive listing ($458 per square foot) was comparable with the cheapest options in up-and-coming areas like Mount Vernon Square and Navy Yard. Take a look to see how your neighborhood stacks up.
