Unless you’ve been avoiding television, the internet, and every single ounce of conversation for the past fifteen years, you’ll know that DC real estate is and has been bounding off the charts. Homes are being resold for twice their last purchase price, garages are listed for nearly a million dollars, and buyers react with glee when a two-bedroom is “only” listed at $800,000.
But the folks over at District Measured have produced a chart that will really drive the point home: homes in the central corridor of DC have, in many cases, doubled or tripled in median price since 2001.
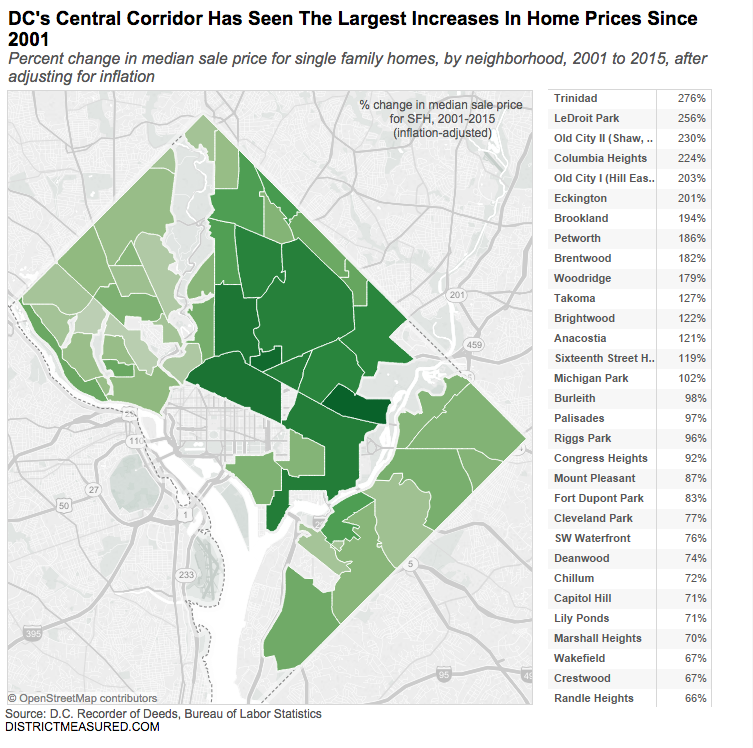
These homes still aren’t, on average, the most expensive in the District–that title belongs to Kalorama, where the median home price hovers just above $2.4 million. Home prices in Brookland and Eckington, for comparison, which both saw approximately a 200 percent price shift since 2001, remain around $600,000. But the most notable changes since the housing market’s 2008 dive aren’t exactly where you’d expect. While Logan Circle, Shaw, Hill East, and H Street have certainly boomed, the pace of growth in Trinidad has been colossal, with median home prices rising 141 percent.
Start saving your pennies, Washingtonians.
Head over to District Measured to see the full post.

Hillary writes about interiors, real estate, arts, and culture. She is the former digital media editor of The New Republic, and her work has also been published in Glamour, The New York Times Book Review, and The Washington Post, among others. You can follow her on Instagram @hillarylouisekelly or on Pinterest @hlkelly.